

TradingView is one of the most popular platforms for charting and analysis—and the Qstick Indicator, created by Tushar Chande, is a powerful tool to add to your strategy.
In this step-by-step guide, you’ll learn exactly how to set up and use the Qstick Indicator on TradingView, how to customize it, and how to interpret its signals for smarter trades.
What Is the Qstick Indicator? (Quick Recap)
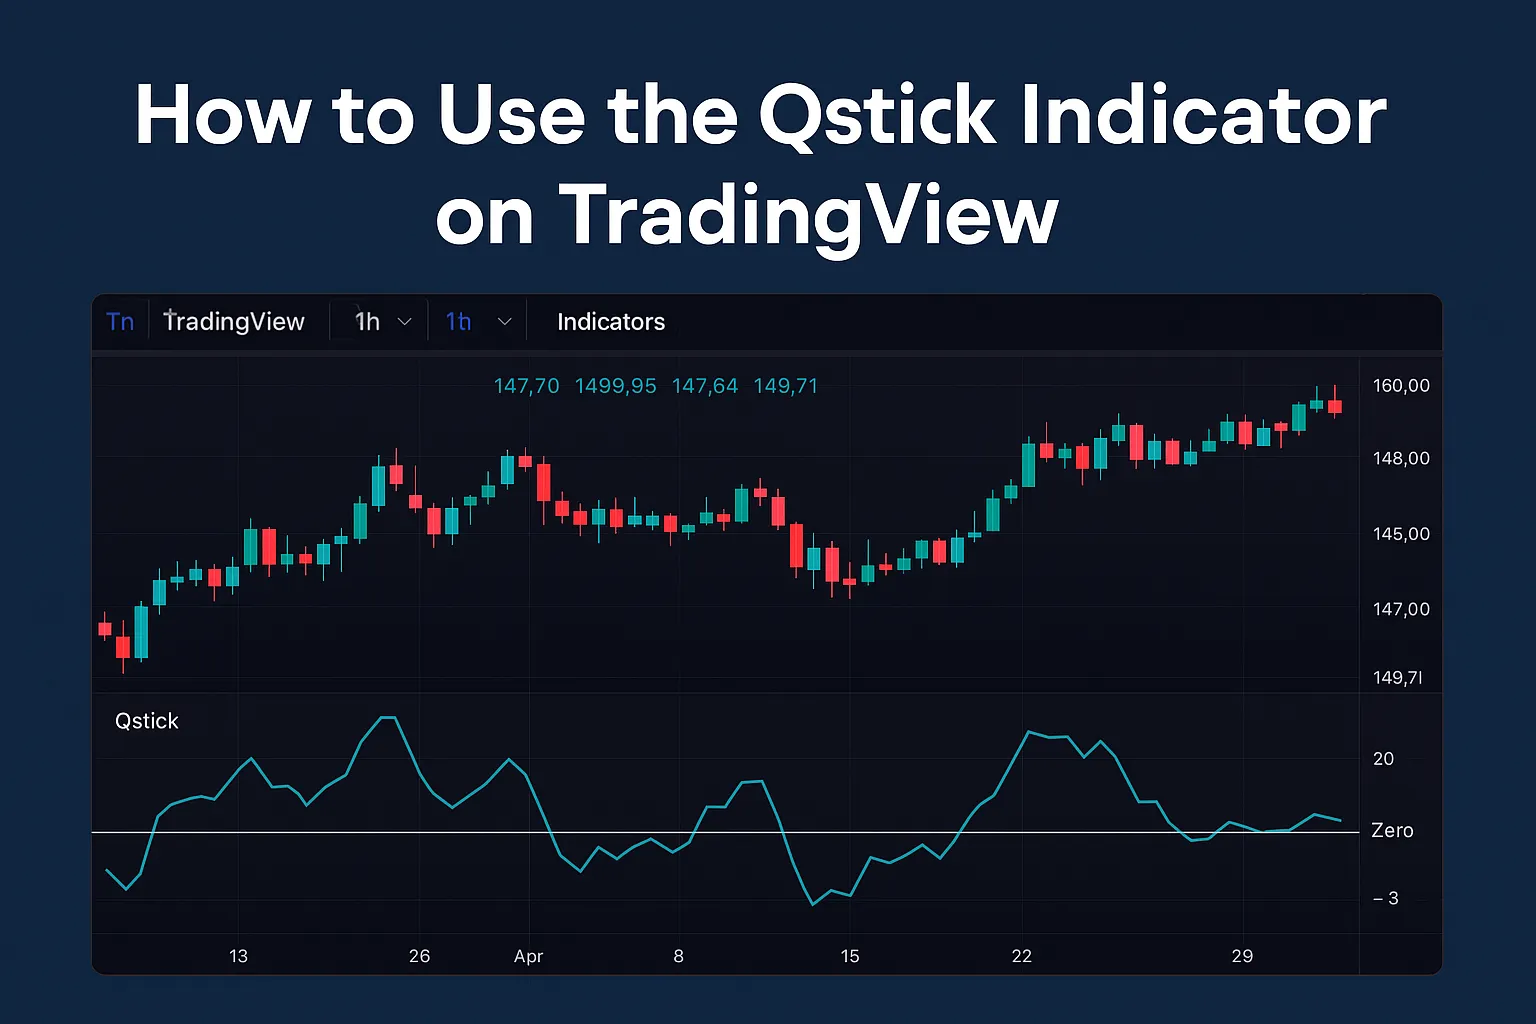
The Qstick Indicator measures the average difference between the closing and opening prices over a specified number of periods.
- Above zero = Bullish sentiment
- Below zero = Bearish sentiment
- Zero-line crossovers act as trade signals
It’s ideal for spotting momentum and trend strength using candlestick body patterns.
Step-by-Step: How to Add Qstick on TradingView
✅ Step 1: Open Your TradingView Chart
- Go to tradingview.com
- Log in to your account (free or paid)
- Choose your trading pair (e.g., AAPL, BTCUSD, EURUSD)
✅ Step 2: Access the Indicator Menu
- Click on the “Indicators” button at the top of the chart.
✅ Step 3: Search for Qstick
- Type “Qstick” in the search bar.
- You may see:
- Built-in versions (rare)
- Community scripts (most common)
- Choose a highly rated script titled “Qstick Indicator” or “Qstick by [Author Name]”.
✅ Step 4: Apply the Indicator
- Click once on the script.
- The Qstick line will now appear in a separate panel below your chart.
How to Customize the Qstick Indicator on TradingView
Once added, you can fine-tune the settings:
🔧 Access Settings
- Hover over the indicator → Click the gear ⚙️ icon
🔧 Recommended Settings
- Length/Period: 14 (default) — Adjust based on timeframe
- Moving Average Type:
- SMA for smoother signals
- EMA for faster responsiveness
- Line Color & Style: Customize for better visibility
🔧 Set Alerts (Optional)
- Right-click on the Qstick line → “Add Alert”
- Use this to get notified when Qstick crosses the zero line
How to Interpret Qstick Signals on TradingView
✅ Bullish Signal
- Qstick crosses above zero
- Indicates more candles are closing above their opens
❌ Bearish Signal
- Qstick drops below zero
- Suggests bearish momentum is building
Confirmation Tip: Combine Qstick with trend tools (e.g., MA) or momentum tools (e.g., RSI) for better accuracy.
Qstick + Strategy Example
Timeframe: 1-Hour (Swing Trading)
Setup:
- Qstick crosses above zero
- RSI > 50 and trending upward
- Price breaks above recent resistance
➡️ Trade: Enter long
➡️ Stop-loss: Below recent swing low
➡️ Exit: When Qstick reverses below zero or RSI shows divergence
FAQs
1. Is the Qstick available in TradingView by default?
It’s not built-in, but several high-quality community scripts are available for free.
2. Can I change Qstick to use EMA instead of SMA?
Yes. Many scripts allow switching between SMA and EMA in the settings.
3. Does Qstick work on all TradingView timeframes?
Absolutely. Use it on any timeframe—just adjust the period accordingly.
4. Can I use Qstick with TradingView alerts?
Yes. You can set alerts for zero-line crossovers or custom thresholds.
5. Is Qstick good for crypto or forex charts on TradingView?
Yes. Qstick works on stocks, crypto, forex, and indices equally well.


