

n trading, the old saying “the trend is your friend” remains true. But spotting trends early — and staying with them — requires a reliable tool. That’s where the Qstick Indicator shines.
Created by Tushar Chande, the Qstick offers a simple, visual method to capture buying and selling momentum over time, making it a favorite among trend traders.
In this post, we’ll break down exactly why the Qstick Indicator is great for trend trading and how you can use it to trade smarter.
What Makes the Qstick Perfect for Trend Trading?
1. Measures Real Market Sentiment
The Qstick Indicator looks at the difference between closing and opening prices.
- A positive Qstick suggests strong bullish sentiment.
- A negative Qstick indicates dominant bearish sentiment.
✅ Why it matters: It captures what traders are actually doing — buying or selling — not just the closing price.
2. Smooths Out Noise
Markets are noisy. Random price spikes can easily fool traders.
The Qstick uses a moving average (SMA or EMA) of candlestick body differences, filtering out short-term fluctuations and giving you a clearer view of the trend.
✅ Why it matters: It prevents overreacting to small, irrelevant moves.
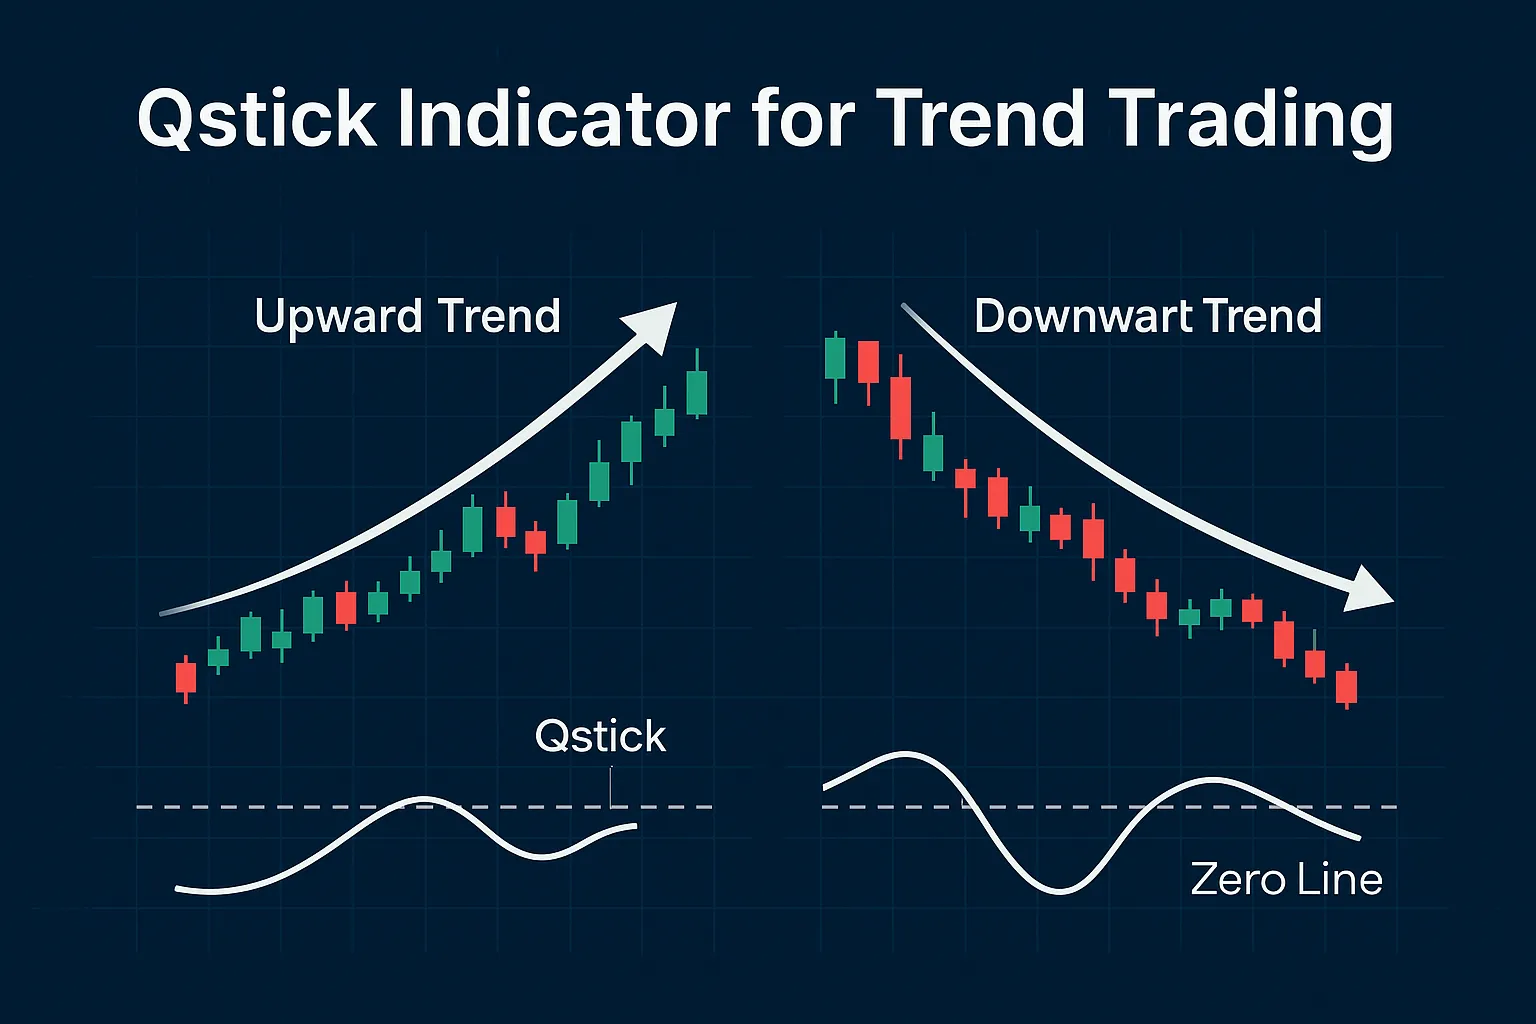
3. Simple Zero-Line Cross Signals
The Qstick provides easy-to-read buy and sell signals:
- Cross above zero = potential bullish trend starting
- Cross below zero = potential bearish trend forming
✅ Why it matters: You don’t need complex chart analysis; just watch the zero-line.
4. Helps Spot Trend Strength
- Sustained positive Qstick readings suggest a strong uptrend.
- Sustained negative Qstick readings show a strong downtrend.
You can hold winning trades longer by using Qstick as a trend filter.
✅ Why it matters: It boosts your ability to ride the trend, not exit too early.
5. Versatile Across Timeframes and Assets
The Qstick works effectively across:
- Day trading (5-min, 15-min charts)
- Swing trading (1-hour, 4-hour charts)
- Position trading (daily, weekly charts)
It’s also compatible with stocks, forex, futures, and crypto.
✅ Why it matters: You can apply one tool everywhere without confusion.
How to Use Qstick for Trend Trading (Simple Strategy)
- Set up the Qstick Indicator with a 14-period EMA for faster trend detection.
- Identify the trend direction based on the Qstick line:
- Above zero = bullish bias
- Below zero = bearish bias
- Confirm the trend with a moving average (like 50-SMA or 100-SMA).
- Enter trades only in the direction of the trend.
- Exit when the Qstick crosses back to the opposite side.
Example
- Qstick crosses above zero, 50-SMA trending upward =
➡️ Look for buy setups only (breakouts, pullbacks). - Qstick crosses below zero, 50-SMA trending downward =
➡️ Look for short setups only.
Pro Tips for Using Qstick Effectively
- Use a longer Qstick period (20 or 30) for smoother trends in volatile markets.
- Combine with volume indicators to validate breakouts.
- Monitor divergences between price and Qstick for early warnings of trend exhaustion.
FAQs
1. Is the Qstick better for trend trading or scalping?
It’s best suited for trend trading across higher timeframes, but can be adapted for scalping with a shorter period.
2. What is the ideal Qstick setting for trend trading?
Many traders use a 14-period EMA-based Qstick, but adjusting to 20-period for smoother signals is common.
3. Should I use Qstick alone?
While Qstick is powerful, combining it with trend tools like Moving Averages or RSI improves accuracy.
4. Can Qstick help avoid false breakouts?
Yes. Watching the Qstick line in combination with volume and price action helps you avoid false moves.
5. Does Qstick work in sideways markets?
It’s less effective in choppy markets. Focus on strong trending conditions for best results.


