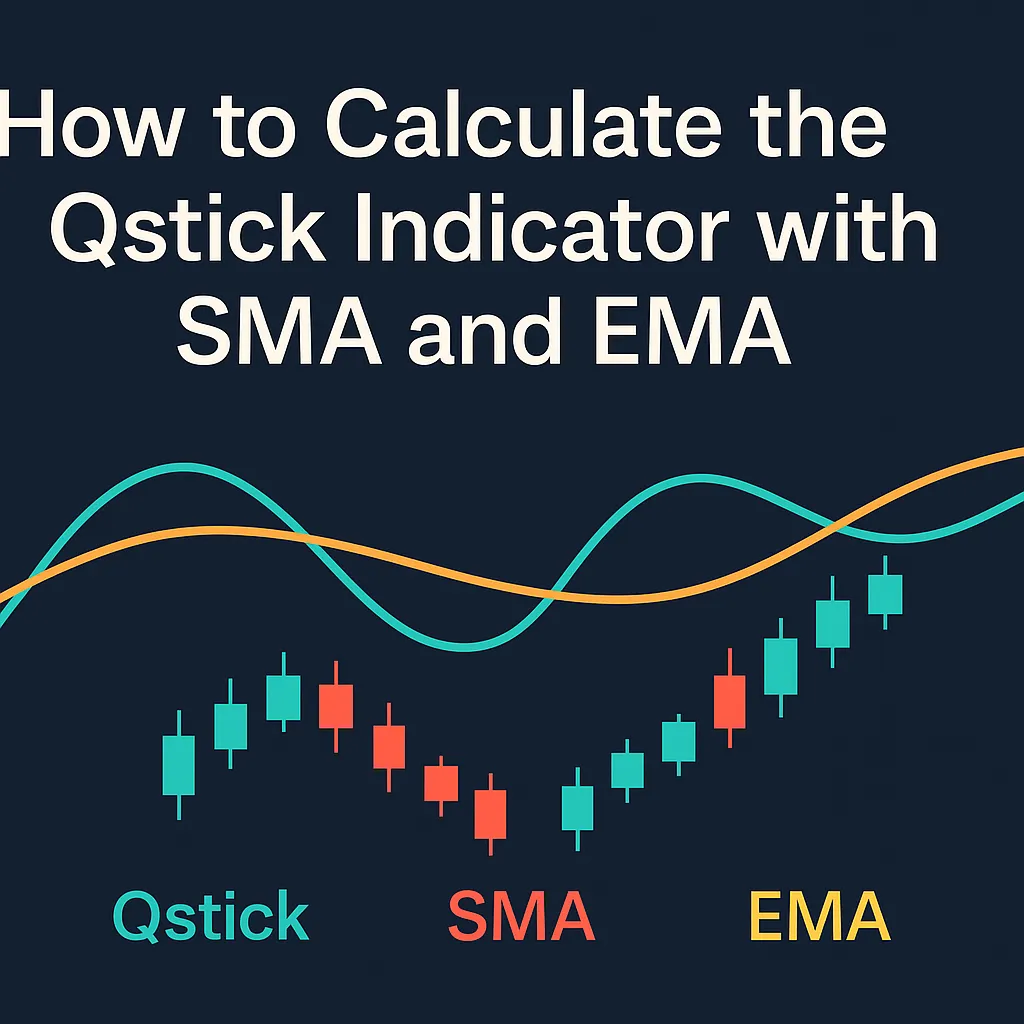
The Qstick Indicator, developed by Tushar Chande, is a unique tool in technical analysis. It measures buying and selling pressure by analyzing the average difference between closing and opening prices over a period.
While most traders use a Simple Moving Average (SMA) to calculate the Qstick, it’s also possible to use an Exponential Moving Average (EMA) for a faster, more responsive version.
In this guide, you’ll learn step-by-step how to calculate the Qstick Indicator with both SMA and EMA.
What is the Qstick Indicator? (Quick Recap)
The Qstick Indicator helps traders:
- Quantify candlestick body momentum
- Spot bullish or bearish sentiment
- Identify potential trade opportunities with zero-line crossovers
The basic formula is:
iniCopyEditQstick = Moving Average of (Close - Open)
The moving average can be either Simple (SMA) or Exponential (EMA), depending on your trading style.
How to Calculate the Qstick Indicator Using SMA
Here’s a step-by-step breakdown:
Step 1: Find the Candlestick Body Values
For each period (e.g., each day or candle):
iniCopyEditBody = Close Price - Open Price
Positive if the close is higher than the open (bullish), negative if lower (bearish).
Step 2: Choose a Period
Common periods include 8, 14, or 20.
Example: 14 periods (candles).
Step 3: Apply Simple Moving Average (SMA)
Calculate the simple average of the body values over the selected period.
Formula for SMA:
mathematicaCopyEditSMA = (Sum of Body Values over N periods) / N
Where N = the number of periods (e.g., 14).
This SMA becomes your Qstick Indicator value.
How to Calculate the Qstick Indicator Using EMA
The calculation method slightly changes when using EMA.
Step 1: Find the Candlestick Body Values
Same as before:
iniCopyEditBody = Close Price - Open Price
Step 2: Choose a Period
Again, select a period like 14.
Step 3: Apply Exponential Moving Average (EMA)
Instead of a simple average, you calculate an exponentially weighted average. EMA gives more weight to recent candles.
Formula for EMA smoothing constant:
iniCopyEditMultiplier = 2 / (N + 1)
Where N = number of periods (e.g., 14).
EMA Calculation:
- The first EMA value is the SMA of the first N periods.
- Subsequent EMA values are calculated with:
iniCopyEditEMA = (Body Value - Previous EMA) × Multiplier + Previous EMA
This EMA becomes your Qstick Indicator value using EMA.
SMA vs EMA for Qstick Calculation: Which is Better?
| Aspect | SMA | EMA |
|---|---|---|
| Calculation Style | Equal weight for all periods | More weight to recent periods |
| Sensitivity | Slower to react to new price changes | Faster reaction to new price movements |
| Use Case | Smoother trend confirmation | Quick identification of new momentum |
- SMA Qstick is better for longer-term trend following.
- EMA Qstick is ideal for short-term or intraday trading.
Example of Qstick Calculation
Let’s say you have 5 candlestick body values:
| Period | Open | Close | Body (Close – Open) |
|---|---|---|---|
| 1 | 100 | 102 | +2 |
| 2 | 101 | 100 | -1 |
| 3 | 99 | 101 | +2 |
| 4 | 100 | 98 | -2 |
| 5 | 98 | 99 | +1 |
SMA Qstick for 5 periods:
CopyEdit(2 - 1 + 2 - 2 + 1) / 5 = 0.4
The Qstick Indicator value = 0.4 (mildly bullish).
EMA Qstick would weight the last few periods more heavily, adjusting the result toward the most recent price action.
FAQs
1. What is the default setting for the Qstick Indicator?
Most platforms use a 14-period Simple Moving Average (SMA) by default.
2. Can I switch between SMA and EMA on charting platforms?
Some platforms allow you to choose between SMA and EMA manually, while others require custom scripts.
3. Which is better for day trading: SMA or EMA?
EMA is generally better for day trading due to its faster responsiveness.
4. Does the Qstick Indicator work with crypto charts?
Yes, it works across all asset classes, including crypto, stocks, and forex.
5. How can I make the Qstick more reliable?
Combine it with volume indicators, RSI, or MACD for better trade confirmation.


