

In the world of technical analysis, many indicators have stood the test of time, helping traders better understand price action and momentum. Among these is the Qstick Indicator, a simple yet effective tool introduced by Tushar Chande. This blog explores the history, purpose, and evolution of the Qstick Indicator, and why it still holds value for traders today.
Who is Tushar Chande?
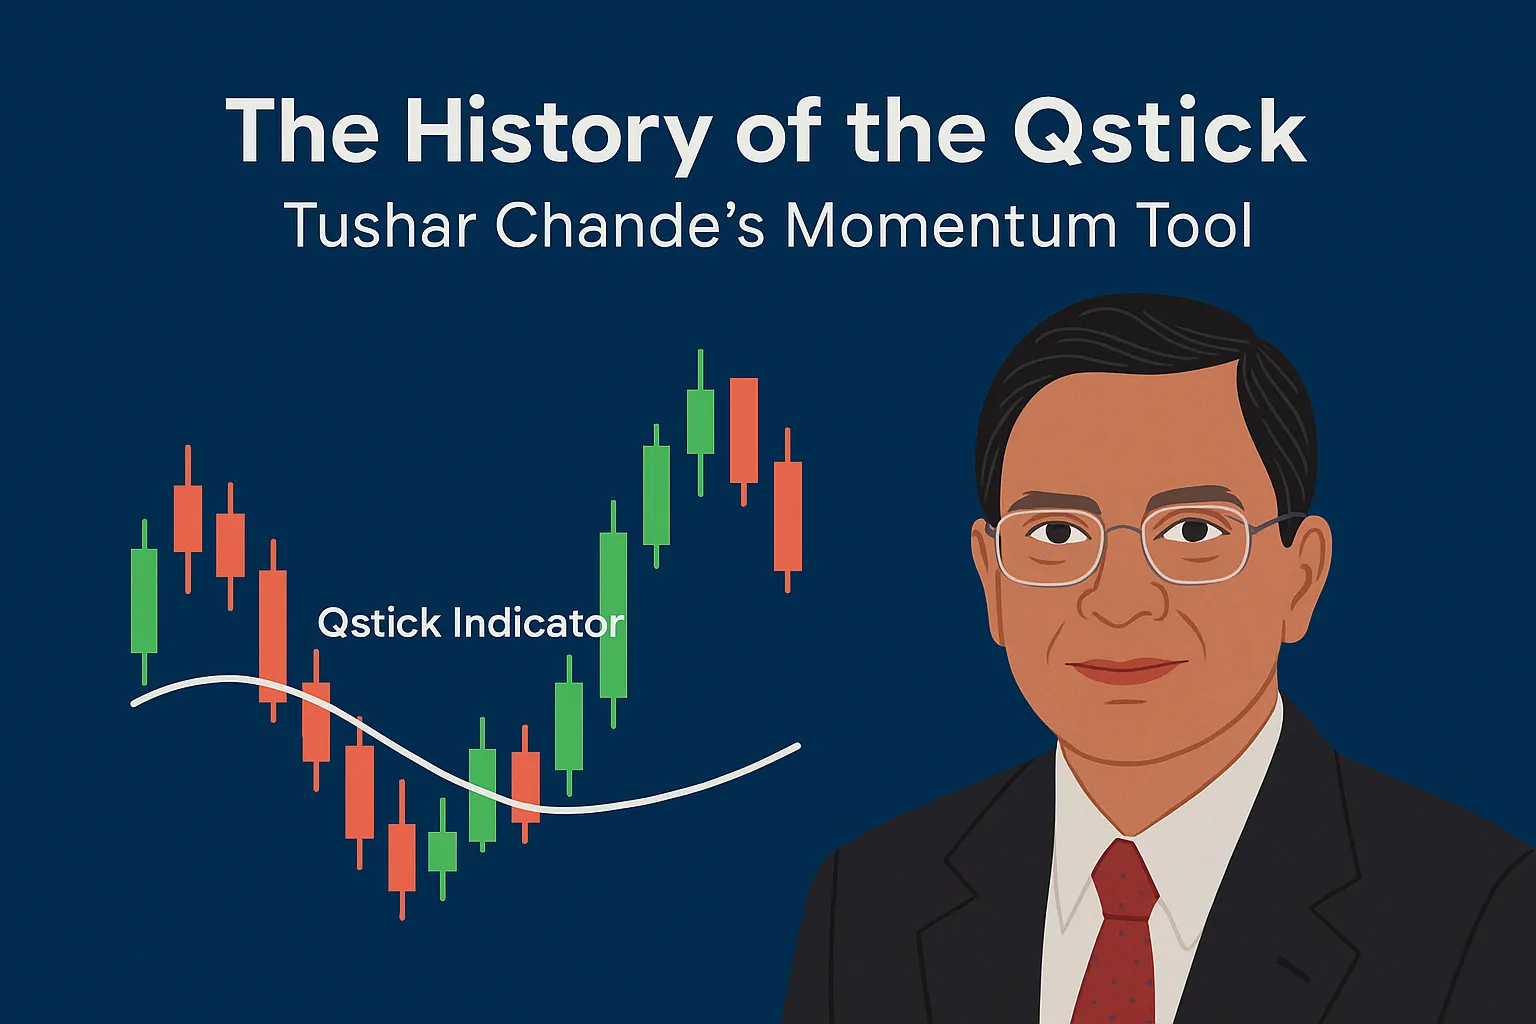
Tushar Chande is a respected figure in the field of technical analysis and market forecasting. A mechanical engineer by training and a financial analyst by passion, Chande has developed several notable trading indicators, including:
- Aroon Indicator
- Chande Momentum Oscillator (CMO)
- Qstick Indicator
Chande’s work is characterized by his desire to simplify trading signals while maintaining analytical rigor, making his tools ideal for both beginners and seasoned traders.
Why Was the Qstick Indicator Developed?
In traditional candlestick analysis, traders visually inspect candles to determine bullish or bearish pressure. However, manual analysis can be subjective and inconsistent, especially across hundreds of charts.
Tushar Chande introduced the Qstick as a quantitative way to measure the average candlestick body size over time, helping traders automate their assessment of market sentiment.
His goal was clear: remove bias and create an objective measure of buying or selling strength.
How the Qstick Became Popular
After its introduction, the Qstick gained traction because it offered several unique advantages:
- Simplicity: It calculates the moving average of the open-close differences.
- Zero Line Crosses: Provided easy-to-read bullish and bearish signals.
- Compatibility: It blended well with other indicators like RSI and MACD.
- Versatility: Applicable across all markets—stocks, forex, futures, and crypto.
Over time, traders began incorporating the Qstick into larger trading systems, confirming trends and spotting early reversals.
Evolution of the Qstick in Modern Trading
Today, the Qstick Indicator is readily available on platforms like:
- TradingView
- MetaTrader 4 and 5 (MT4/MT5)
- NinjaTrader
- ThinkorSwim
While newer momentum tools have emerged, the Qstick remains relevant because of its simplicity, effectiveness, and adaptability. Traders often combine it with volume analysis, moving averages, or volatility bands to fine-tune their entries and exits.
Key Contributions of the Qstick to Technical Analysis
- Introduced a numerical approach to candlestick body analysis.
- Helped popularize zero-line crossover strategies.
- Offered a bridge between price action analysis and mathematical modeling.
Thanks to Tushar Chande’s work, the Qstick Indicator continues to serve as a valuable tool for traders seeking clarity in complex markets.
FAQs
1. When was the Qstick Indicator developed?
The Qstick was introduced in the early 1990s by Tushar Chande to automate candlestick body analysis.
2. What does the Qstick Indicator measure?
It measures the average difference between the closing and opening prices over a specific period, helping identify bullish or bearish market sentiment.
3. Is the Qstick Indicator still used today?
Yes, many traders use it today, often in combination with other momentum and trend-following indicators.
4. What other indicators did Tushar Chande create?
Tushar Chande also developed the Aroon Indicator and the Chande Momentum Oscillator (CMO).
5. Can the Qstick Indicator be used for forex or crypto trading?
Absolutely! The Qstick works across all asset classes, including stocks, forex, futures, and cryptocurrencies.


