

When markets move, traders want to know one thing: is the trend bullish or bearish? The Qstick Indicator, created by Tushar Chande, offers a simple yet powerful way to answer this question by analyzing the behavior of candlestick bodies.
In this blog post, you’ll learn how to use the Qstick to spot trends, confirm market direction, and improve your trading decisions with clarity and confidence.
What Is the Qstick Indicator?
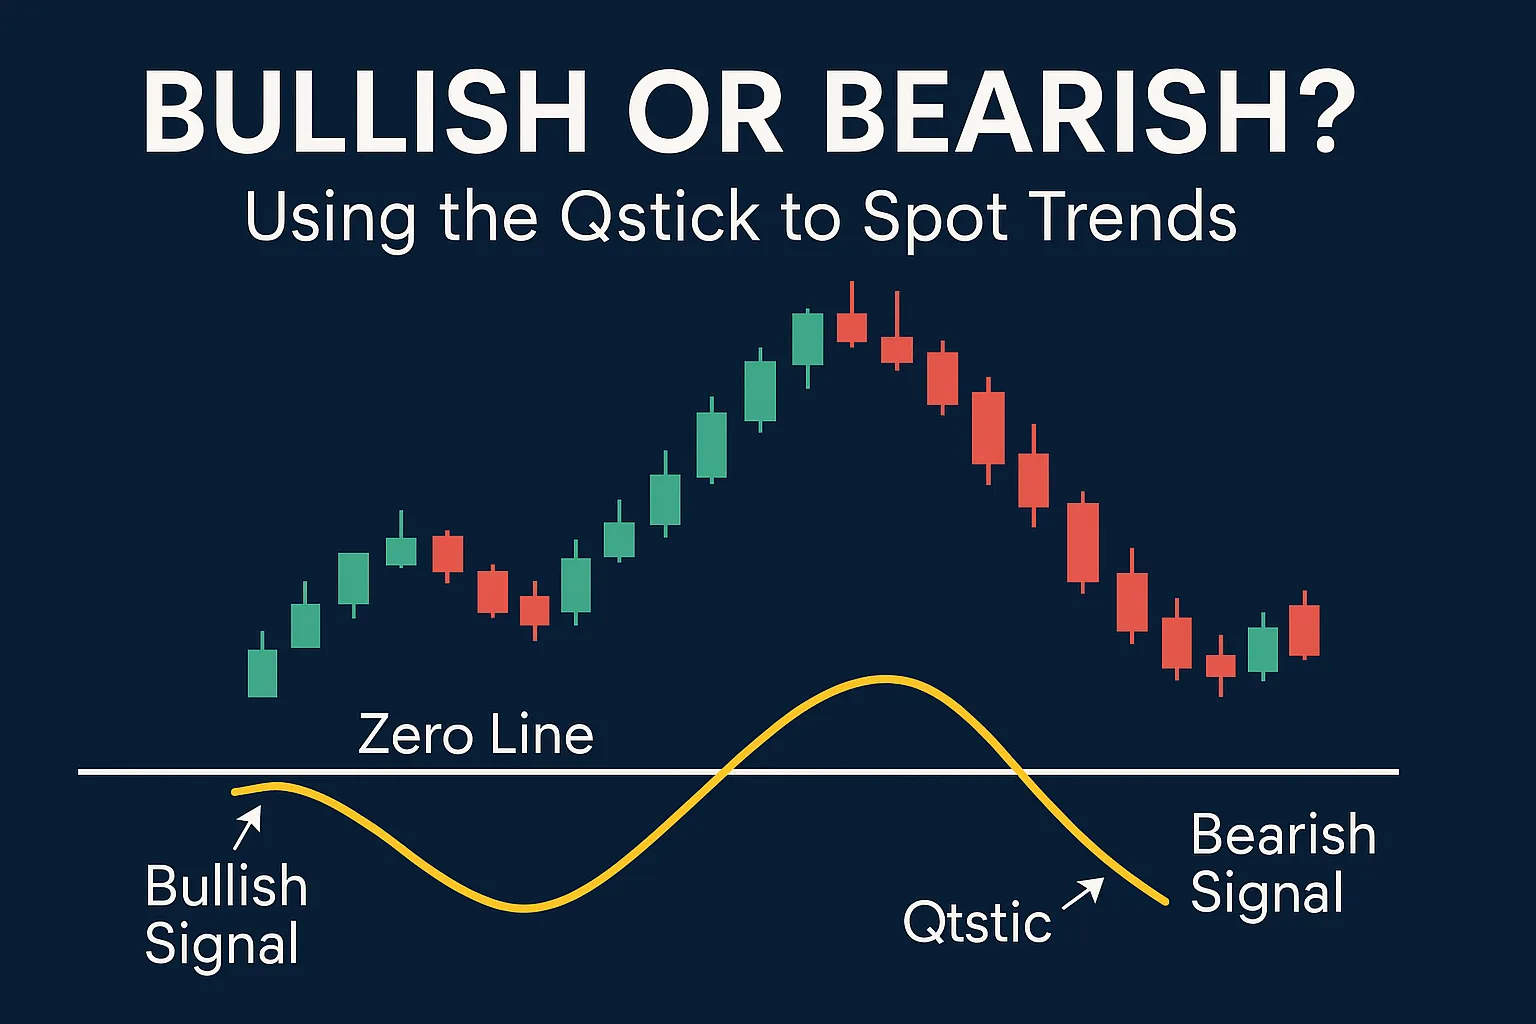
The Qstick Indicator is a momentum-based tool that calculates the average difference between the close and open prices over a chosen period.
- If the average is positive, the trend is bullish.
- If the average is negative, the trend is bearish.
It acts as a quantified candlestick body analyzer, turning complex price action into a simple signal.
Why Use Qstick to Spot Trends?
- Clear visual signals: It shows rising or falling momentum at a glance.
- Zero-line crossover: Acts as an easy threshold to distinguish trend direction.
- Filters noise: Averages out short-term fluctuations to show real sentiment.
How to Identify a Bullish Trend with Qstick
✅ Signal #1: Qstick Above Zero
When the Qstick line stays above the zero line, it means most candles in the period are closing above their opens—showing sustained buying pressure.
✅ Signal #2: Rising Qstick Line
Even if Qstick is below zero, a rising line may indicate a bullish reversal is forming.
✅ Best Confirmation Tools:
- Rising Moving Averages
- Bullish volume spikes
- Support zone breakout
How to Identify a Bearish Trend with Qstick
❌ Signal #1: Qstick Below Zero
If the Qstick line dips and holds below zero, it shows consistent selling pressure.
❌ Signal #2: Falling Qstick Line
Even when Qstick is above zero, a falling line suggests bullish momentum is weakening, and a reversal may be near.
✅ Best Confirmation Tools:
- Falling RSI
- Resistance zone rejection
- Breakdown with high volume
Spotting Trend Reversals with Qstick
Qstick also helps with early trend reversal detection:
- A move from negative to positive Qstick = potential bullish reversal.
- A move from positive to negative Qstick = possible bearish reversal.
Divergence Tip:
If price makes higher highs, but Qstick makes lower highs, bearish reversal may follow.
How Long Should the Qstick Stay Above or Below Zero?
There’s no fixed rule, but here are some guidelines:
- 3+ candles above zero → stronger bullish trend
- 3+ candles below zero → stronger bearish trend
Adjust your holding strategy based on how long the Qstick confirms trend continuation.
Best Practices for Using Qstick to Spot Trends
- Use EMA-based Qstick for faster trend detection.
- Apply Qstick on higher timeframes (4H, daily) for reliable trend signals.
- Combine with price structure (support/resistance, breakouts) for context.
- Avoid low-volume markets, as Qstick signals may be less accurate.
FAQs
1. Can Qstick predict future trends?
No indicator predicts the future. Qstick helps you read current sentiment and confirm trend direction.
2. What is the best Qstick setting for spotting trends?
A 14-period Qstick with EMA is common for medium-term trend analysis.
3. Should I trade only when Qstick crosses zero?
Zero-crosses are great entry points, but watch the slope of the Qstick line and confirm with trend indicators.
4. Is Qstick better for trending or ranging markets?
Qstick works best in trending markets where directional bias is important.
5. Can I use Qstick with price action alone?
Yes. Qstick enhances candlestick analysis by adding quantifiable pressure data.


