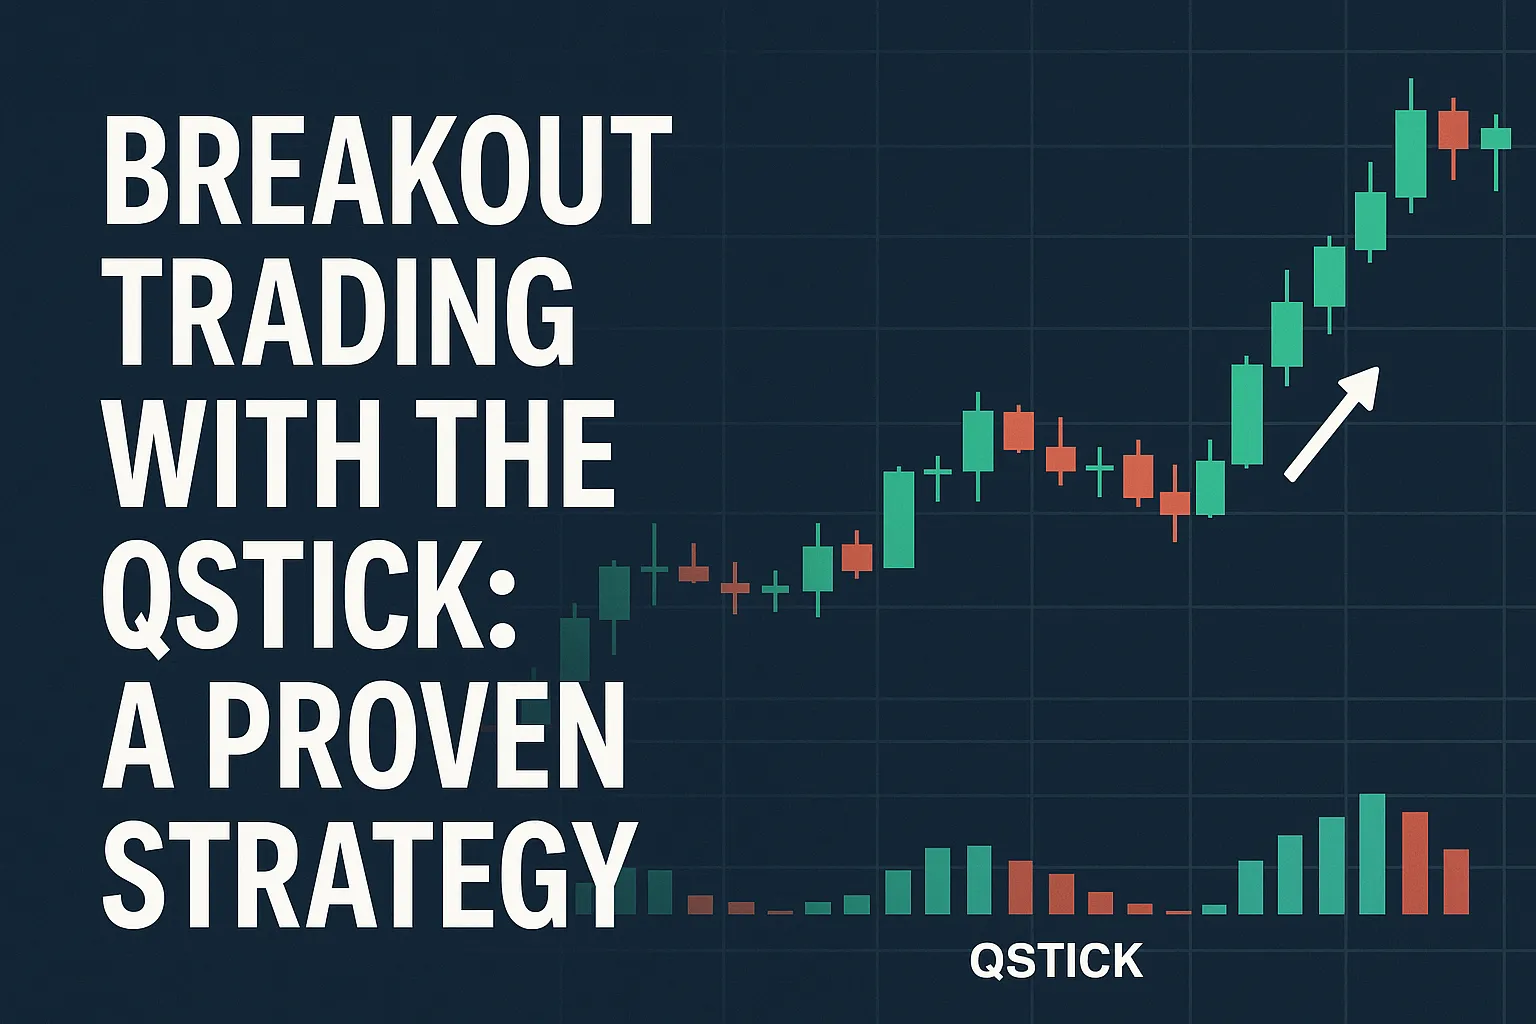
Breakout trading is one of the most powerful ways to catch big market moves. But not every breakout is genuine — many are false and lead to losses.
That’s where the Qstick Indicator comes in.
In this guide, you’ll learn how to combine breakout patterns with the Qstick Indicator to filter false breakouts and ride strong trends.
Let’s dive into the proven method for Breakout Trading with Qstick.
Why Use the Qstick Indicator for Breakout Trading?
The Qstick Indicator measures candlestick body momentum — it shows whether bulls or bears are dominating.
✅ It confirms real market sentiment behind price movements.
✅ It reduces the chances of falling into false breakouts.
✅ It gives early trend continuation signals.
Perfect for trading chart breakouts like:
- Support/Resistance Breakouts
- Trendline Breakouts
- Channel Breakouts
- Consolidation Breakouts
Step-by-Step: Breakout Trading Strategy with Qstick
✅ Step 1: Identify a Breakout Setup
Use basic price action patterns:
- Horizontal support/resistance levels
- Trendlines connecting higher lows or lower highs
- Consolidation zones (flags, triangles, rectangles)
Example: Price consolidating under a resistance level.
✅ Step 2: Watch for the Breakout
Wait for a clear candlestick breakout beyond the pattern boundary.
- Bullish Breakout: Price closes above resistance.
- Bearish Breakout: Price closes below support.
✅ Step 3: Confirm with Qstick Indicator
- For a bullish breakout, ensure the Qstick is rising and above zero.
- For a bearish breakout, ensure the Qstick is falling and below zero.
Avoid entering if the Qstick is flat or shows opposite momentum!
✅ Step 4: Enter the Trade
- Enter at the next candle open after confirmation.
- Bullish Trade: Buy after a positive breakout and bullish Qstick confirmation.
- Bearish Trade: Sell after a negative breakout and bearish Qstick confirmation.
✅ Step 5: Set Stop-Loss and Target
- Stop-Loss: Just below the breakout level (bullish) or just above (bearish).
- Target: Use a Risk-Reward Ratio of at least 1:2, or trail your stop as the trade moves in your favor.
Example: Breakout + Qstick Trade Flow
| Step | Bullish Setup |
|---|---|
| 1 | Resistance at $100 identified |
| 2 | Price breaks $100 and closes at $102 |
| 3 | Qstick crosses above zero and rising |
| 4 | Buy at $102.5, Stop-loss at $99.5 |
| 5 | Target $107 or trail for bigger move |
Why This Strategy Works
- Qstick confirms real buying/selling strength behind the breakout.
- Reduces fakeouts where price briefly crosses a level but fails.
- Improves success rate by filtering low-quality breakouts.
Tips for Success
- Look for volume spikes alongside Qstick confirmation for stronger signals.
- Use multiple timeframe analysis: Confirm breakout on higher timeframe too.
- Avoid trading breakouts during major news events unless you’re an advanced trader.
FAQs
1. Can I use this Qstick breakout strategy for forex and crypto?
Yes, it works for stocks, forex, crypto, commodities — any liquid market.
2. What Qstick settings should I use?
14-period EMA is a good starting point for breakout trading.
3. Can I automate this breakout + Qstick strategy?
Yes. Many custom EAs or TradingView scripts allow you to combine breakouts and indicator conditions.
4. What is the best timeframe for this strategy?
1-hour and 4-hour timeframes are most effective for clean breakout trades.
5. What if Qstick and breakout don’t align?
Skip the trade! Alignment is crucial for high-probability setups.


