

No single indicator is perfect. That’s why smart traders combine tools that complement each other. One powerful trio is the Qstick, RSI, and MACD. Each focuses on a different aspect of price action — sentiment, momentum, and trend — giving you more accurate trade signals.
In this blog, you’ll learn how to combine the Qstick with RSI and MACD to improve your trade entries, reduce false signals, and gain confidence in trend confirmation.
Why Combine Indicators?
- Qstick shows market sentiment using candlestick body strength.
- RSI (Relative Strength Index) measures momentum and overbought/oversold zones.
- MACD (Moving Average Convergence Divergence) reveals trend direction and momentum shifts.
Together, they form a complete picture of price behavior.
1. How Each Indicator Works
Qstick
- Measures the average difference between closing and opening prices.
- Positive Qstick = bullish sentiment
- Negative Qstick = bearish sentiment
RSI
- Ranges from 0 to 100.
- Above 70 = overbought, possible reversal down.
- Below 30 = oversold, possible reversal up.
MACD
- Consists of MACD line, signal line, and histogram.
- Line crossovers or zero-line breaks signal trend momentum shifts.
2. Best Use Cases When Combining Qstick, RSI, and MACD
✅ Bullish Trade Setup
- Qstick is rising and above zero
- RSI is above 30 but below 70 (no overbought signal)
- MACD crosses above signal line or above the zero line
➡️ Entry: Enter long
➡️ Stop-loss: Below recent swing low
➡️ Exit: When Qstick falls below zero or RSI crosses below 70
✅ Bearish Trade Setup
- Qstick is falling and below zero
- RSI is above 30 but turning down
- MACD crosses below signal line or falls below zero
➡️ Entry: Enter short
➡️ Stop-loss: Above recent swing high
➡️ Exit: When Qstick crosses above zero or RSI drops to 30
3. Why This Combo Works
| Indicator | Strength |
|---|---|
| Qstick | Sentiment through candlestick bodies |
| RSI | Identifies exhaustion zones (reversals) |
| MACD | Shows trend momentum and crossovers |
✅ Combined Benefit:
When all three align, you reduce the risk of false signals and get strong confirmation for high-probability trades.
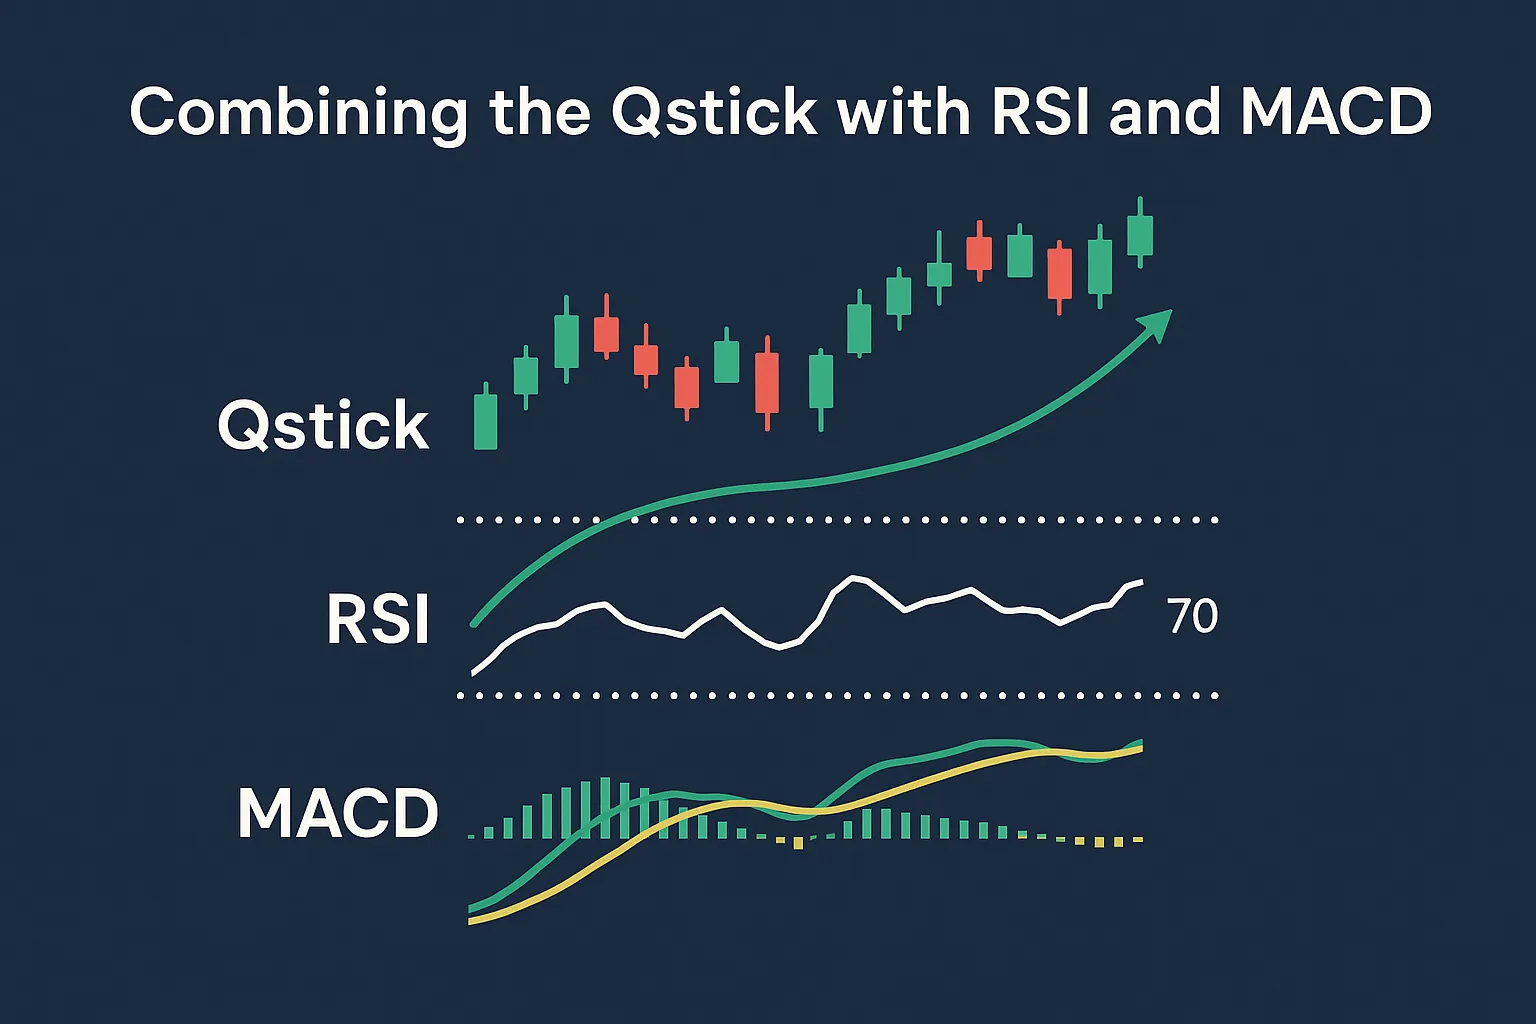
4. Chart Example (Visual Setup)
Imagine:
- Qstick line crosses above zero
- RSI rises from 40 to 60
- MACD line crosses above the signal line
This alignment = ideal long trade condition.
Use this confluence approach on 1-hour, 4-hour, or daily charts for optimal reliability.
5. Tips for Using the Trio Effectively
- Don’t force signals. Wait for alignment.
- Use EMA in Qstick for quicker signals.
- RSI divergence + Qstick reversal = early entry edge.
- Confirm breakouts or breakdowns with MACD histogram expansion.
FAQs
1. Can I use this combination for intraday trading?
Yes. Use 5-minute or 15-minute charts with adjusted settings (e.g., 9-period Qstick).
2. Which should I trust most: Qstick, RSI, or MACD?
They work best together. Qstick shows sentiment, RSI confirms overbought/oversold, and MACD confirms the trend.
3. What’s the best time to enter using all three?
When all three indicators align within a 1–2 candle window — it’s a strong setup.
4. Do I need a special charting platform?
No. Platforms like TradingView, MetaTrader 4/5, and ThinkorSwim support all three indicators.
5. Can I automate this strategy?
Yes. You can create a custom trading bot or script to trigger alerts when all three align.


