

If you want a simple, visual way to spot buying and selling pressure in the markets, learning how to read Qstick Indicator signals can be a game-changer. Developed by Tushar Chande, the Qstick Indicator measures candlestick body strength and helps traders easily identify bullish or bearish momentum.
In this post, we’ll walk through how to read Qstick signals, common patterns to watch for, and simple tips to apply in real-world trading.
Quick Recap: What is the Qstick Indicator?
The Qstick Indicator calculates the moving average of the difference between closing and opening prices over a set period (like 8, 14, or 20 candles).
- Positive Qstick = More bullish candles (closing above opening)
- Negative Qstick = More bearish candles (closing below opening)
How to Read Qstick Indicator Signals
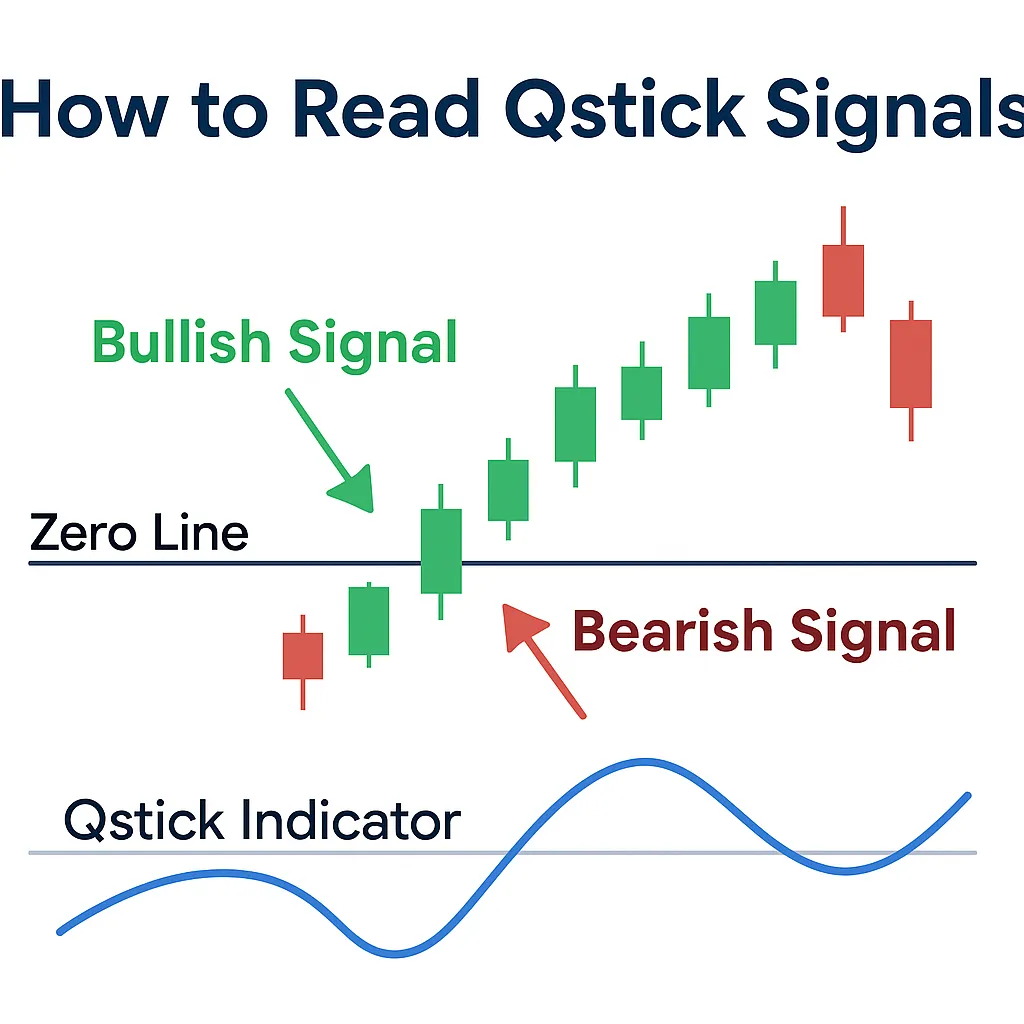
1. Zero-Line Crossovers
✅ Bullish Signal:
When the Qstick crosses above the zero line, it suggests increasing buying pressure.
- Traders often interpret this as a buy signal.
✅ Bearish Signal:
When the Qstick crosses below the zero line, it suggests increasing selling pressure.
- Traders often treat this as a sell signal.
Tip: Always wait for the candle to close before acting on the crossover.
2. Sustained Positive or Negative Readings
- Sustained Positive Qstick readings confirm a strong uptrend.
- Sustained Negative Qstick readings indicate a solid downtrend.
✅ How to Use:
- Stay in trades longer if the Qstick stays above zero.
- Exit long trades or consider short trades if the Qstick stays below zero.
3. Qstick Divergence Signals
✅ Bullish Divergence:
- Price forms lower lows, but Qstick forms higher lows.
- This suggests weakening selling pressure and a possible reversal upward.
✅ Bearish Divergence:
- Price forms higher highs, but Qstick forms lower highs.
- Indicates weakening buying pressure and a potential reversal downward.
Tip: Combine divergences with volume or candlestick reversal patterns for stronger signals.
4. Sharp Qstick Reversals
Sometimes the Qstick line makes a sharp U-turn near the zero line.
- A sharp reversal from negative to positive can signal the start of a new bullish trend.
- A sharp reversal from positive to negative can hint at the start of a new bearish trend.
✅ Best Application:
- Look for sharp reversals on higher timeframes like daily or 4-hour charts.
How to Confirm Qstick Signals
Because no indicator is 100% reliable, it’s smart to confirm Qstick signals with other tools:
- Moving Averages: Trade only when the price is aligned with the larger trend.
- Volume: Higher volume during crossovers strengthens the reliability of the signal.
- Support/Resistance: Confirm signals near key price levels.
Common Mistakes to Avoid
- Acting on intrabar signals: Always wait for a candle close before acting.
- Ignoring larger trends: Trade Qstick signals in the direction of the dominant trend.
- Overtrading: Only act on high-quality signals; not every crossover deserves a trade.
Example of a Basic Qstick Signal Strategy
| Step | Action |
|---|---|
| 1 | Wait for Qstick to cross above zero. |
| 2 | Confirm with a rising moving average. |
| 3 | Enter a buy trade after candle close. |
| 4 | Place a stop-loss below recent support. |
| 5 | Exit when Qstick crosses back below zero. |
Simple. Clean. Effective for beginners!
FAQs
1. What does a positive Qstick reading mean?
It indicates that bullish candles (closing higher than opening) dominate the market.
2. Is the Qstick Indicator good for scalping?
Yes, especially on short timeframes like 5-minute or 15-minute charts.
3. Can the Qstick Indicator give false signals?
Yes. That’s why it’s important to combine it with trend direction and volume confirmation.
4. Should I use SMA or EMA for Qstick calculation?
Both work. EMA offers faster signals, while SMA smooths out more noise.
5. Does the Qstick Indicator work for crypto and forex?
Absolutely! It’s effective across stocks, forex, futures, and cryptocurrencies.


