

In the world of technical analysis, traders use various tools to determine market momentum and price trends. One such lesser-known but powerful tool is the Qstick Indicator. This guide will walk you through what the Qstick Indicator is, how it works, and how you can use it effectively—even if you’re just getting started with trading.
What is the Qstick Indicator?
The Qstick Indicator is a technical analysis tool developed by Tushar Chande. It measures the difference between the open and close prices over a given period to determine the general direction of market sentiment. It is essentially a moving average of candlestick bodies.
Unlike oscillators like RSI or MACD that focus on price momentum, the Qstick focuses specifically on the body of each candle—a clear indicator of buying or selling pressure.
How Does the Qstick Indicator Work?
The Qstick Indicator calculates the average difference between close and open prices over a set number of periods (commonly 8, 10, or 14). The formula is:
iniCopyEditQstick = Moving Average (Close - Open)
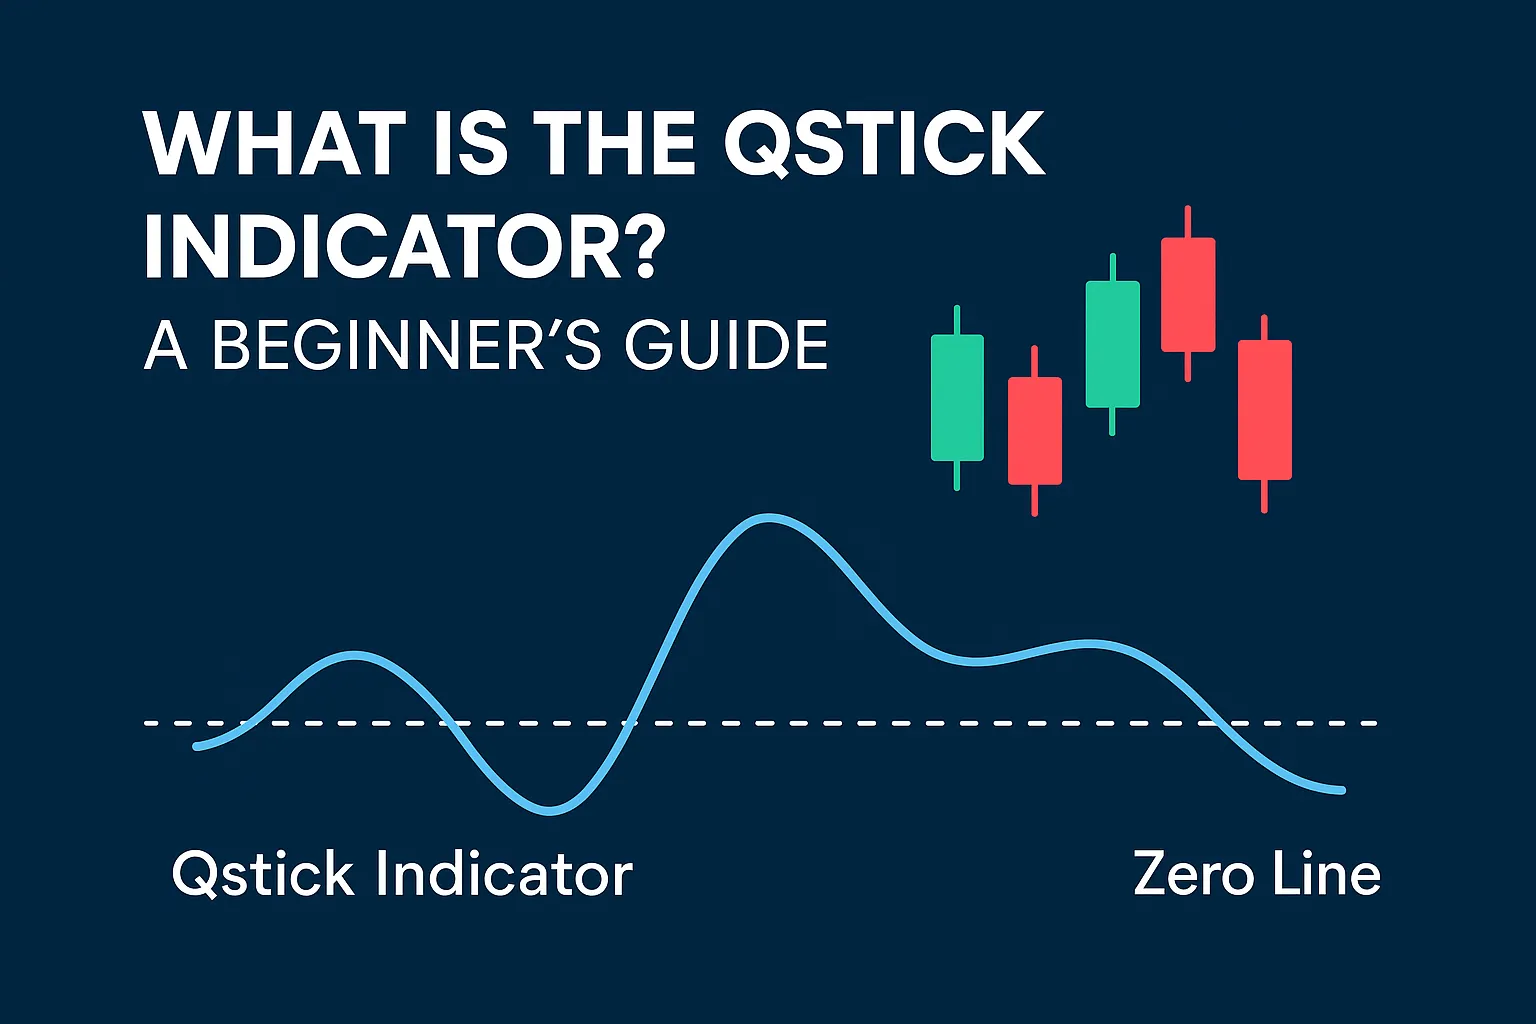
- Positive values indicate bullish sentiment (more closes above opens).
- Negative values suggest bearish sentiment (more closes below opens).
- Crossing the zero line is often used as a buy/sell signal.
Why Use the Qstick Indicator?
- Simple to understand — Ideal for beginners in technical analysis.
- Clear trend signals — Helps identify the direction of the market.
- Great with candlestick patterns — Complements visual chart analysis.
- Works on multiple timeframes — Suitable for intraday and swing trading.
- Pairs well with other indicators like RSI and MACD.
How to Use the Qstick Indicator in Trading
- Bullish Signal: When the Qstick crosses above the zero line, it suggests growing buying pressure—potential time to enter a long trade.
- Bearish Signal: When the Qstick dips below zero, it indicates selling pressure—consider exiting or shorting.
- Confirm with Volume or RSI: Use other indicators for confirmation to avoid false signals.
- Adjust the period: Shorter periods (e.g., 8) are more sensitive, while longer ones (e.g., 20) smooth out noise.
Limitations of the Qstick Indicator
- Lagging nature: Being a moving average, it may react slowly to sudden market reversals.
- Not a standalone signal: Best used in combination with other indicators or chart patterns.
- Doesn’t show volatility: Unlike Bollinger Bands or ATR, Qstick doesn’t account for price ranges or extremes.
Best Platforms to Use the Qstick Indicator
- TradingView
- MetaTrader 4 (MT4)
- MetaTrader 5 (MT5)
- NinjaTrader
- ThinkorSwim
FAQs
1. What does the Qstick Indicator measure?
It measures the average difference between the closing and opening prices over a specific period, indicating market sentiment.
2. Is the Qstick Indicator good for beginners?
Yes, it’s simple to use and offers clear buy/sell signals.
3. Which timeframe is best for the Qstick Indicator?
It can be used on any timeframe, but 14-period on daily or 5-minute charts is common.
4. Can I use Qstick with RSI or MACD?
Absolutely. It’s often more effective when used in conjunction with momentum indicators like RSI or MACD.
5. Where can I get the Qstick Indicator?
Most charting platforms like TradingView, MT4, and MT5 offer the Qstick Indicator by default or as a custom script.


